
Meaning and Importance of Financial Ratios
Financial ratios are crucial in understanding the financial health of a company. They are the perfect tool to evaluate if one should invest in a company. Financial ratios will help you take informed investment decisions.
Financial Ratios –
- Help investors track the company’s past and present performance.
- Helps us understand the relationship between various components of financial statements.
- Help in comparative analysis across other companies in an industry.
In a nutshell, financial ratios can be one of the biggest tools for an investor while investing in the stock market. They make comparative analysis easier. Today, we will discuss some important financial ratios that every investor must know. You must make it a thumb rule and check these ratios before you make any investments
Let’s have a look at four types of financial ratios:
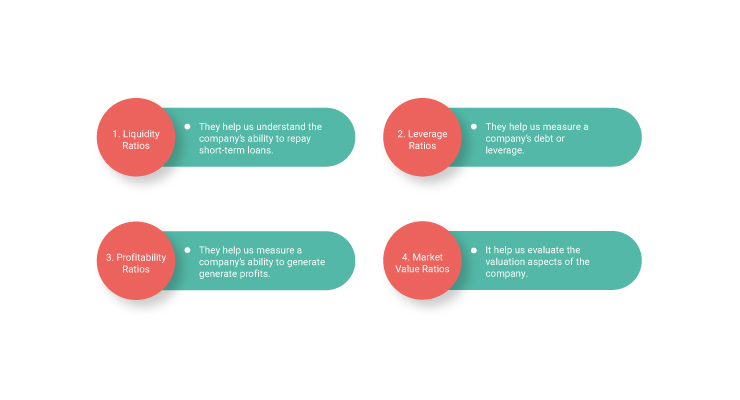
1. Liquidity Ratios
Can you survive on zero cash? Absolutely not. Similarly, a company must have cash balance to ensure smooth operations.
Liquidity ratio helps us measure a company’s ability to meet its short-term commitments. These are financial obligations due in less than 12 months.
Watch our video to learn about the liquidity ratio
The four main types of Liquidity ratios are:
- Current Ratio
- Quick Ratio or Acid Test Ratio
- Operating Cash Ratio
- Cash Ratio
A. Current Ratio
It shows the ability of a company to pay loans due in less than one year with existing assets. It is also known as Working Capital Ratio.
Current ratio formula = Current Assets / Current Liabilities
Current assets include:
- Cash in bank or cash in hand.
- Marketable securities – common stocks, commercial papers, treasury bills
- Bank Deposits
- Mutual fund investments
- Accounts receivable from debtors
- Inventory (raw materials or finished goods)
Current liabilities are loans payable in less than 12 months. It includes …
- Short term loans from creditors
- Wages and salaries
- Taxes
- Cash credit or overdraft
- Advance from customers
- Loan Instalments
Ideal current ratio lies between one and three. A high current ratio means the company has enough current assets to meet short term liabilities. It suggests they are financially strong.
A low current ratio means the company's financial health is poor and may also indicate chances of default. It means the company might face difficulties honouring short-term obligations.
B. Quick Ratio
It is also known as acid-test ratio. It measures a company’s ability to repay its short-term liabilities (less than three months) with its quick assets. Quick assets do not include inventory because inventory is a type of a short-term asset which cannot be necessarily monetized in a very short period of time.
Quick Ratio Formula = ( Current assets – Inventories ) / Current Liabilities
An ideal quick ratio is 1:1.
If the quick ratio is high the company may keep too much cash on hand. Or have a poor collection program for accounts receivable.
If the quick ratio is low the company relies too heavily on inventory to meet its obligations.
C. Operating Cash Ratio
It is the number of times a company can pay off its liabilities from the revenue generated in the same period.
Operating cash ratio formula = Operating cash flow / Current Liabilities
An operating cash flow ratio of less than one suggests the company has not generated enough cash to cover its short-term liabilities.
D. Cash Ratio
It measures the company’s ability to repay its short-term liabilities with cash and cash equivalents only. These are the most liquid current assets found on a business's balance sheet. It includes bank balance and other marketable securities. For example, commercial paper and short-term bonds.
Cash ratio formula = Cash & Cash Equivalents / Current Liabilities
2. Leverage Ratios or Solvency Ratio
Leverage ratio is also known as solvency ratio. They help us compare the debt levels of a company to its assets and equity. It measures the company’s ability to meet long-term debt obligations.
Investors must always check the company’s debt position before investing. You must avoid companies with huge debts on their balance sheet. Let us discuss two important solvency ratios.
A. Debt to Equity Ratio (DE Ratio):
Debt to Equity Ratio Formula = Total Liabilities / Shareholder’s Equity
DE ratio is one of the most important ratios to understand a company's financial health. It measures how much debt a company owes with respect to its shareholder’s equity.
A high debt to equity ratio is not a favourable sign for equity investors as it signifies high risk.
DE ratio of 1:1 suggests the company has equal equity for debt. Hence, companies with DE ratio of less than 1 are relatively safer.
DE ratio of more than 2 is considered to be risky. It means for every Rs. 1 in equity, the company owes Rs. 2 of debt.
Watch our video to learn about debt to equity ratio
B. Interest Coverage Ratios :
Interest Coverage Ratio Formula = EBITDA / Interest Expense
It tells you whether a company can pay timely interest on its loans with its current earnings. High interest coverage ratio means that the company can make timely interest payments and is a good sign for debt investors..
3. Profitability Ratio
At what rate is the company’s profit growing?
How much profit is the company able to earn on its capital employed?
Profitability ratios help us find answers to such questions.
These ratios help us compare profitability across companies in particular industry. Some important profitability ratios are:
A. Return on Equity (ROE):
ROE formula = Net Income / Shareholder’s Equity
ROE measures a company’s ability to generate profit for its equity shareholders profit for its equity shareholders. It tells us how much money the company earns on an investor’s capital Companies with consistent growth in ROE are preferable than uneven returns. The higher the ROE ratio, the higher the profitability.
B. Return on Asset (ROA):
Return on Assets formula = Net Profit / Total Assets
ROA measures the efficiency with which the management uses its assets to generate returns. The ROA of ITC Ltd. is 17.8%. This means that the company generates Rs 17.8 for every Rs 100 in assets.
High returns suggests that the company is able to efficiently use its resources to maximise its profits. On the other hand, low returns suggest inefficiency in the use of the company's assets to generate revenue.
C. Return on Capital Employed (ROCE):
ROCE formula = Earnings Before Interest and Tax (EBIT) / Capital Employed
ROCE measures how much returns a company is generating for its investors. The difference between ROE and ROCE is very minute but important.
ROE measure the return generated by a company on its equity capital only. ROCE ratio is calculated on the entire capital base i.e. it includes debt capital as well in the same calculation which gives us a better picture of the company.
Higher the ROCE, the better the investment opportunity and vice versa.
4. Market Value Ratios
evaluate the current share price of a company. They help to identify if a particular stock is fairly priced. Let’s discuss two important market value ratios -
A.Earnings Per Share (EPS)
Earnings Per Share Formula = Net Income / Total outstanding shares
EPS is the net income earned by the company for each outstanding share. It serves as an indicator of a company’s profitability.
A high EPS ratio is always favourable for investment. It suggests that the company is capable of generating a dividend for its investors.
If a company has zero or negative earnings then earnings per share will also be zero or negative.
B. Price to Equity (PE) Ratio
Price to Equity Ratio Formula = Share Price / Earnings Per Share
PE ratio is one of the most important ratios used to analyse a company. It helps investors understand the relative value of a company’s share price to its earnings.
Watch this video where we explain how to use PE ratio while analysing a stock.
C. Price to Book Value Ratio (PB Ratio)
Price to Book Value Formula = Market Capitalisation / Book Value of Assets
PB ratio is the amount investors are willing to pay for a share in the company’s assets. It compares a company’s stock price with its net assets. Net assets is total assets minus total liabilities.
This ratio helps us understand if the stock is overvalued, undervalued, or fairly valued. This ratio is usually more important for financing companies.
Generally, a low PB ratio (less than 1) indicates that the stock is undervalued. Whereas, a higher PB ratio (greater than 1) means the stock is overvalued.
Recommended Read: How to use Price to Book Value Ratio to analyse stocks
End Note:
These were few of the many financial ratios which you must analyse while investing. You will find all the data to calculate these ratios in the company’s annual report. Always do a thorough ratio analysis before investing in a company.
These ratios will help you make informed investment decisions.
But, merely calculating and comparing financial ratios is not enough. To discover quality companies to invest in, you must conduct fundamental analysis. This includes quantitative as well as qualitative approaches to avoid making costly investment mistakes.
Before investing, there are hundreds of companies and thousands of elements to analyse. Conducting such a scale of evaluation on your own can be time consuming. To make your life and your investment journey easier, we have something for you.
Presenting StockBasket, expertly curated baskets of stocks to meet all your financial goals. We curate a mini-stock portfolio to cater to your varied financial goals.
Are you new to investing? Finding a good profitable investing is not a cake walk. Especially if you are about to make your first investment.
Hence, StockBasket offers you a Beginners Basket - Lite.
Beginners Basket is created for beginners looking for safe stocks to invest in. Beginners Basket generated a whopping 106% returns on investment in the past 5 years (as of 23rd August, 2021). The investors only had to invest in the basket, hold their investment for a long term and sit back to relax.
Investing in this basket, you will have one less thing to worry about. Our research experts will monitor your basket to ensure maximum returns and safety. Moreover, you can start with your investment of just Rs 2,500 in your preferred basket.
Be it retirement planning basket or international education planning basket, we have it all!
Explore the list of stock baskets here.Open a FREE Demat account with Samco and get free access to StockBasket!


Leave A Comment?